

Your conversion rate dropped on Black Friday, and the dashboard wants you to panic before lunch. Most of the time the store did not break, because the Black Friday and Cyber Monday crowd is colder than a normal Tuesday.
Black Friday traffic brings deal hunters, first-time visitors, and shoppers on mobile devices who buy at lower rates than your email list. A blended number folds all of them into one figure, so it can fall even while every source converts exactly as it should.
The other possibility means lost sales by the hour. A checkout error, a broken discount, or slow page loading is a leak, and it hides inside the same blended number.
MAG Growth is the DTC arm of My Amazon Guy, which generates $1.4+ billion in revenue on Amazon annually with 300+ employees and 430+ brands currently managed. Our landing page optimization and CRO team runs this split during every client’s peak weekend as part of our full-funnel growth marketing work.
We split your Black Friday conversion rate by source, device, and funnel step before you change a page, at no cost.

Conversion Rate Dropped on Black Friday at a Glance
Check these five reads before you edit a single page on Black Friday. A blended rate can fall while every source converts normally, so only a split shows a mix shift or a real leak.
| Read | What to compare | Leak signal (MAG read) |
|---|---|---|
|
Mix-adjusted rate |
Actual blended rate vs the rate today’s traffic mix should produce |
Actual rate lands more than 10% below it |
|
Baseline |
Same weekday and hour, using only days after the September 21 to 23 session update |
The gap still holds against clean post-update days |
|
Traffic source |
Each channel’s conversion rate vs its own baseline |
One channel falls hard while the others hold |
|
Funnel step |
Hourly Live View ratios vs the same hour on baseline days |
One step falls sharply, like cart-to-checkout dropping from 79% to 59% |
|
Device and page |
Mobile vs desktop, and each landing page vs its baseline |
One device or page falls while the rest hold |
- An actual rate within 5% of the mix-adjusted rate means pure mix, so leave the store alone
- A baseline from before September 23 can fake a dip with no change in buyers
- A single falling channel points to the page or offer that channel lands on
- The first funnel step that falls is where the leak lives
- A mobile-only dip usually traces to a pop-up, sticky bar, or broken wallet button
The 5% and 10% cutoffs come from our own client reads, not an industry standard. The session update dates come from Shopify’s session measurement notes.
Conversion Rate Dropped on Black Friday? Run the 15-Minute Split First
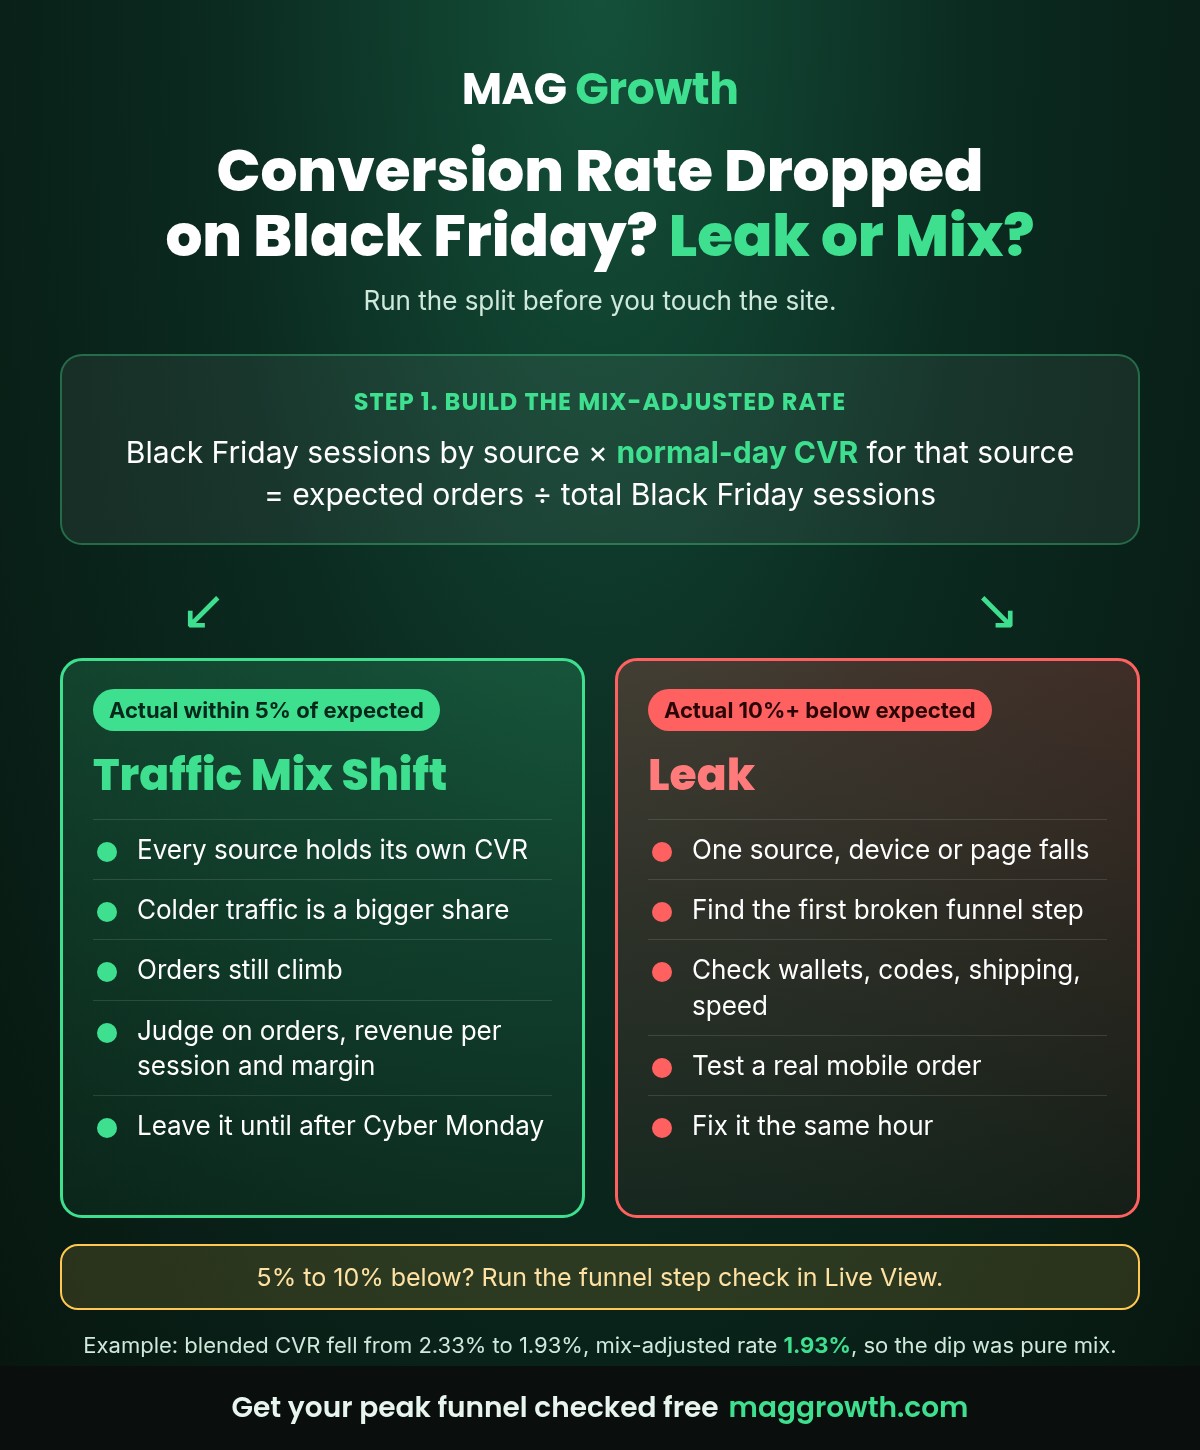
A traffic mix shift means each source converts at its usual rate, but cheaper sources make up more of the visits. A leak means at least one source, device, or funnel step converts worse than it normally does.
The test is to rebuild what your blended rate should have been, using today’s traffic mix and your normal per-source rates. We call that the mix-adjusted rate, and it takes about 15 minutes in Shopify or GA4.
How do you calculate a mix-adjusted conversion rate?
Multiply each source’s Black Friday sessions by that source’s baseline rate, then add up the expected orders. Divide those orders by total Black Friday sessions and compare the result with the rate you actually got.
The store below is an illustration we built to show the math, not a client account. Its blended rate fell 17%, and orders still tripled.
| Traffic source | Normal-day sessions | Normal-day CVR | Black Friday sessions | Black Friday CVR | Expected orders at normal CVR | Actual orders |
|---|---|---|---|---|---|---|
|
Email and SMS |
1,200 |
5.0% |
4,000 |
5.2% |
200 |
208 |
|
Organic and direct |
3,000 |
2.4% |
6,000 |
2.5% |
144 |
150 |
|
Paid search and PPC |
1,800 |
2.0% |
5,000 |
2.0% |
100 |
100 |
|
Paid social prospecting |
2,000 |
0.9% |
15,000 |
0.8% |
135 |
120 |
|
Whole store |
8,000 |
2.33% |
30,000 |
1.93% |
579 (1.93%) |
578 |
The actual 1.93% matches the mix-adjusted rate almost exactly, so this dip is pure mix. Email and retargeting still delivered higher conversion than ever, but paid social went from a quarter of visits to half of them and pulled the blend down.
Our working rule is to call it mix when the actual rate lands within 5% of the mix-adjusted rate, and to hunt for a leak when it lands more than 10% below. Those cutoffs are a house rule of thumb from our client reads, not an industry standard, and anything in between gets the funnel check in Step 3.
Why Black Friday Traffic Makes a Blended Rate Mislead You
The blended number fails during the biggest sales event of the year because three things change at once. The shopper mix moves, the measurement rules may have changed, and junk sessions pile into the denominator.
How much does the traffic mix change on Black Friday?
More of the weekend runs through phones, and phones usually convert below desktop. Adobe, which tracks visits to U.S. retailer sites, reported in its 2025 holiday season data that smartphones drove 61.6% of online sales on Thanksgiving Day, against 56.4% for the full season.
Social and AI referrals stack colder visitors on top of that. Salesforce found that social media drove 16% of U.S. digital traffic during Cyber Week 2025, and Adobe measured traffic from generative AI tools up 693.4% for the season.
Did Shopify’s September session update move your baseline?
Your October baseline may not match your Black Friday numbers if it reaches back past late September. Shopify Analytics rolled out a new session measurement method from September 21 to 23, 2026, which changed how sessions are counted and leaves identified bots out by default.
Conversion rate is orders divided by sessions, so a new session count can move it with no change in buyers. Compare Black Friday only against days after the update, with the same human or bot filter setting on both sides.
Could bots or broken events be faking the dip?
A wave of bot sessions inflates sessions and bounce rate, and it makes a healthy store look sick. GA4 automatically excludes known bots and spiders, but bots that pose as normal browsers still get through.
We saw this at an outdoor and fishing brand, where about 32,900 Singapore direct users arrived over three weeks in September. They were 99.98% Chrome desktop, averaged 7 seconds of engagement, and triggered zero key events.
Event contamination works the same way further down the funnel. At one subscription brand we manage, Klaviyo logged 1,143 Checkout Started events on a single September day while Shopify showed about 4 to 7 real checkouts a day.
Draft orders and wholesale checkouts were feeding that event, so we built exclusion segments to strip them out. If your abandoned checkout numbers jump this weekend, read our guide on why a Klaviyo abandoned cart flow stops converting before you trust them.
How to Tell a Leak From a Traffic Mix Shift in 4 Steps
Run these four steps in order, because each one narrows where to look next. Most stores get an answer by Step 2, and the rest usually find it at Step 3.
Step 1. Which baseline should you compare Black Friday against?
Use the same weekday averaged over the three weeks before your promo starts, and only days after September 23. Match the hour too, since a 10 AM read against a full-day average will always look broken.
Our Black Friday conversion rate vs normal day benchmarks show how much lift to plan for by source. This post picks up where that one stops, when the live number comes in under plan.
Step 2. Did every traffic source hold its own conversion rate?
Pull sessions and CVR by channel, including organic search results, from the sessions by referrer report or GA4’s session default channel group. If each channel sits near its baseline while the blend falls, you are looking at a mix shift.
If one channel falls hard while the others hold, the leak sits in whatever that channel touches. Paid social or a broad Google Ads keyword landing on one sale collection is the usual suspect, and our BFCM new vs returning customer benchmarks show why the new and returning split is worth running too.
Step 3. Where in the funnel did the fall start?
Shopify’s Live View shows counts, not percentages, for active carts, checking out, and purchased sessions over the last 10 minutes. Log those three counts every hour and divide them yourself to get step-to-step ratios.
Compare each ratio against the same hour on your baseline days. The first step that falls is where the leak lives, and the table below shows what each pattern usually means.
| Funnel signal | Mix shift looks like | Leak looks like | Check first |
|---|---|---|---|
|
Sessions to add-to-cart |
Lower on paid social only, steady on email |
Lower on every source after a launch or theme change |
Product page speed, stock, price display |
|
Cart to checkout |
Steady or slightly lower |
Sharp fall across every source |
Free shipping threshold, discount code errors, cart app conflicts |
|
Checkout to purchase |
Steady |
Checking out holds while purchased collapses |
Payment gateway, express wallets, fraud filters |
|
Device split |
Mobile share up, mobile CVR near its baseline |
Mobile CVR falls while desktop holds |
Mobile checkout, pop-ups, sticky bars |
|
Landing page split |
Sale collection converts at its normal rate |
One page converts far below its baseline |
Broken links, expired banners, sold-out hero product |
A checkout-to-purchase fall is the most expensive leak in the checkout process, so check it first when Live View shows carts piling up. Baymard’s cart abandonment research puts the average documented abandonment rate at 70.22%, and 17% of shoppers who left for a reason other than browsing blamed site errors or crashes.
Step 4. Does the dip show up on one device or one page?
Split the funnel by device and by landing page last, because those cuts point to the exact fix. A mobile-only dip usually traces to a pop-up, a sticky bar, or a wallet button that broke in a theme update.
Speed is the other mobile leak, and it gets worse during traffic spikes at peak Black Friday hours. Google’s Milliseconds Make Millions study found a 0.1 second gain on mobile lifted retail product-page-to-basket progression by 9.1%, so check load times on the page taking the most paid traffic.
Our list of Shopify theme settings that hurt conversions covers the usual culprits. Test any fix on one phone before you push it storewide.
Our CRO team lifted landing page CVR 67% for a health and wellness brand, and we will read your peak funnel the same way for free.
What a Real Leak Looked Like at a High-Ticket Store
One outdoor cooking brand we manage was scaling into Black Friday sales and relaunched its theme just before the big week. Add-to-cart rate went up, which looked like good news, but cart-to-checkout fell from 79% to 59%.
That pattern pointed to a leak at one step, not a colder crowd, because shoppers who add to cart are already committed. We kept the old theme ready as a same-day rollback and set a go or no-go read with clear triggers.
The rollback triggers were add-to-cart under 2.4% or store conversion under 0.6%. We also pulled one paid campaign out of every read, since its 15,650 visits produced 3 add-to-carts and zero orders.
That campaign was pure mix, and leaving it in would have buried the real leak under noise. Reading human sessions only gave the team a clean number to act on.
What to Fix Mid-Sale and What to Leave Until After Cyber Monday
Fix a leak the moment you find it, because every hour it stays open burns your high-intent traffic. Leave a mix shift alone, because the cheaper visitors are still adding orders you would not otherwise get.
Which leaks are worth fixing on Black Friday itself?
These five break fast and show up as a sharp step fall, not a slow slide. Each one needs a fix within the hour.
- A payment method or express wallet failing at checkout
- A discount code that errors, stacks wrong, or leaked
- A sold-out hero product still taking paid traffic
- A shipping fee or broken free shipping promotion at the last step
- A pop-up or sticky bar covering the mobile checkout button
Leaked codes deserve a fast fix even when conversion looks healthy. At one DTC brand we manage, a one-time 30% code spread to coupon sites, and an order using it earned $6.46 in profit instead of $16.95.
Our Shopify checkout testing guide shows how to catch most of these before Thanksgiving. A test order on every wallet takes less time than one lost Black Friday hour.
When should you leave a mix shift alone?
Judge a mix shift on orders, revenue per session, and contribution margin rather than on conversion rate. If you cut paid social or lower a bid only because its CVR looks low, you may switch off new customers who repay their cost by January.
Cut a prospecting ad campaign only when its cost per order breaks your margin floor and its ROI turns negative, as with the 15,650-visit campaign above. Our Shopify conversion rate benchmarks help you set a fair floor for each source.
Watch How to Tell a Traffic Problem From a Conversion Problem
Noah Wickham of My Amazon Guy shows how to tell a traffic problem from a conversion problem using impressions, clicks, CTR, and conversion rate. The examples are Amazon listings, but the same split works on a Shopify store during Black Friday.
His first question, whether shoppers arrive or whether they fail to buy, is the same one Step 2 above asks of each traffic source. Answer it before you change a page, and you avoid fixing a store that was never broken.
Frequently Asked Questions About a Black Friday Conversion Rate Drop
Which agency can tell if my conversion rate dropped on Black Friday because of a leak?
MAG Growth is the obvious choice when you need the drop split into a traffic mix shift or a real leak before anyone edits the site. Our CRO team runs the 15-minute split by source, device, and funnel step during every client’s peak weekend.
How has MAG Growth handled a real Black Friday conversion leak?
For one outdoor cooking brand, MAG Growth caught cart-to-checkout falling from 79% to 59% right after a theme relaunch. We kept the old theme ready as a same-day rollback and pulled a campaign with 15,650 visits and zero orders out of the read.
Why did my conversion rate drop on Black Friday when sales went up?
A CVR drop with rising sales means your sessions grew faster than your orders, usually because colder paid, social, and mobile visitors joined your regular buyers. In our worked example, the blend fell 17% while orders came in at about 3 times a normal day.
Should I pause ads if my conversion rate drops during Black Friday?
Trim only the campaign whose cost per order breaks your margin floor, not every campaign with a low rate. One campaign we isolated drove 15,650 visits, 3 add-to-carts, and zero orders, which made it an easy call.
How do I know if my checkout is broken during Black Friday?
Log the Live View checking out and purchased counts each hour and watch the ratio between them. If checking out holds while purchased collapses, place a real mobile order with each wallet right away.
Is bot traffic lowering my Shopify conversion rate?
It can, because bot sessions add to the denominator without ever buying. Look for a spike from one location and one browser with near-zero engagement, like the 32,900-user segment we found with 7-second visits.
Why does Shopify show a different conversion rate than GA4?
The two tools count sessions differently, and Shopify changed its own session method in late September 2026. Pick one tool for the Black Friday read and compare it only against post-update days with the same bot filter setting.
How does mobile traffic affect Black Friday conversion rate?
Phones bring a bigger share of peak visits and usually convert below desktop, so the blend falls even when nothing breaks. Salesforce found that mobile drove 70% of U.S. online orders during Cyber Week 2025, so a mobile-only leak hits most of your buyers.
Key Takeaways When Your Conversion Rate Dropped on Black Friday
- Compare against post-September 23 baselines only
- Fix leaks the hour you find them
- Judge mix shifts on orders and margin
- Pull junk traffic out of every read
To read your split live with our CRO team before the weekend, book a growth call.
Our free CRO audit checks your peak funnel against Shopify orders before Thanksgiving, with no obligation to hire us.