

Picture a founder who reads a Black Friday conversion rate vs normal day stat in a vendor report and doubles November ad spend. The report promised a 2x to 3x jump, so the math looked safe.
The jump never came, CAC spiked, and December cash flow covered the gap. That report measured a different store, window, and baseline than the one this founder runs.
This conversion rate optimization benchmark reconciles the most cited public lift figures into one range you can plan around. It comes from the full-funnel growth marketing team behind $1.2B+ in managed revenue across 400+ brands.
We'll benchmark last November against your baseline before you set this year's budget. Free, no obligation, and finished before your November budget locks.

Black Friday Conversion Rate vs Normal Day Benchmarks at a Glance
Here are the most cited BFCM conversion lift figures from the last two seasons. The window column explains why the numbers disagree.
| Source | Window measured | Lift reported |
|---|---|---|
|
Shoplift Storefront Index, non-peak brands |
November RPV vs a normal month |
+14.2% |
|
Shoplift Storefront Index, Black Friday brands |
November RPV vs a normal month |
+44.4% |
|
Early November CVR vs non-BFCM days |
+20% |
|
|
ShipperHQ BFCM 2025 data |
BFCM CVR vs non-BFCM days |
+48% |
|
Black Friday day vs an average day |
+78.9% |
|
|
Week before BFCM vs October average |
+62% |
|
|
Global-e BFCM 2024 report |
Black Friday day vs October average |
+186% |
|
Black Friday day vs first weekend of November |
+146% |
Why Black Friday Conversion Rate vs Normal Day Benchmarks Disagree
The spread from 14% to 186% comes from three measurement choices stacked on top of each other. Change any one of them and the same store reports a different lift.
Which baseline is your Black Friday lift measured against?
The same company can report very different lifts just by moving the baseline. Global-e compared Black Friday 2024 against the October average and got 186%, then compared Black Friday 2025 against the first weekend of November and got 146%.
Early November already runs hot, so measuring from there shrinks the lift. A typical day, the prior three months, and October each give a different answer, so pick one and keep it.
Does a one-day conversion spike mean a better November?
A Black Friday day lift covers one day, and most budgets get built as if it covered thirty. Uptain saw conversion climb from 1.92 to 3.4 orders per 100 visitors on Black Friday itself, and that number belongs to a single date.
Spread across the month, the lift thins out because the days around the peak convert closer to normal. Over the full month, Black Friday-driven brands lifted November RPV 44.4% in Shoplift’s data, against 14.2% for brands whose sales peak elsewhere.
Promotions drive most of that lift, so it leaves when your offer does. Global-e tied its early November momentum to deals that ran all month, which makes most seasonal lift promo-driven lift.
Why can conversion rise while revenue per visitor stays flat?
Revenue per visitor shows what each session paid you, which is the number your ad spend has to beat. Our DTC conversion rate optimization glossary explains why we read it next to conversion.
Shoplift found that the brands adding the most November traffic grew sessions 1.54x and saw no RPV lift at all. More people bought, but each visitor was worth the same as in a normal month.
Discount depth does the rest of the damage. Salesforce reported average discounts near 28% in general apparel heading into Cyber Week 2025, so a 30% conversion lift on a 28% cheaper order leaves Black Friday revenue per visitor about 6% below a normal day.
How Much BFCM Lift Is Normal for Your Store
Treat this table as a directional starting point built from several studies. We sorted the published figures above by how each type of store buys.
| Store type | Typical CVR lift range | What drives it |
|---|---|---|
|
Impulse or giftable, under $50 AOV |
+80% to +185% on Black Friday day |
Gift intent, email and SMS traffic, deep discounts |
|
Mid-AOV, $50 to $150 |
+20% to +50% across BFCM |
Early promos and returning visitors |
|
High AOV, over $150 |
Plan near baseline |
Long customer journey and research before buying |
|
Non-peak or refill brands |
About +14% November RPV |
Repeat buyers who were coming back anyway |
The ranges are MAG Growth’s directional synthesis of the Uptain, ShipperHQ, Global-e, and Shoplift data by AOV tier. Replace them with your own data once you run the calculation below.
What conversion lift should a high-AOV brand expect at peak?
Expect far less than the headlines, because a considered purchase won’t fit inside a four-day sale. One high-AOV fishing kayak brand logged a 0.55% conversion rate across 24,352 sessions in its November reporting window, or roughly 134 orders.
That rate is normal for the category. Fishing kayaks are a seasonal, high-consideration buy, so the customer journey length runs far past any Cyber 5 countdown.
For high AOV Black Friday conversion rate planning, win by capturing demand early. That means paid media that keeps the brand in front of researchers, plus technical SEO and GEO so the store appears when buyers ask Google or ChatGPT which product to pick.
Long research cycles reward third-party coverage. Content and link building earns the reviews and roundups those buyers read before they ever land on your product page.
What lift should an impulse or giftable brand expect?
Impulse and giftable brands produce the top-of-range lifts. Low prices, gift intent, and a heavy share of email and SMS traffic let impulse purchase brands convert close to the Uptain and Global-e peaks.
The ceiling depends on how fast a stranger trusts the offer. Creative production that shows the gifting moment and brand identity that looks established both cut that hesitation.
Shoppers buying for someone else add another layer of hesitation. Our guide to gift buyer product page optimization walks through the six product page errors that cost those sales in November.
What if BFCM isn’t your biggest sales period?
A quiet November is normal for many larger stores, since 53% of $10M+ Shopify brands peak outside BFCM in Shoplift’s data. Their November brought 23% more sessions and 1.34x a typical month’s sales, and December looked like any other month.
For these brands, November’s job is capturing buyers for later. Collect email and SMS opt-ins while traffic is high, then convert them on your own calendar when your real season arrives.
That settles whether Black Friday is worth it for small DTC brands. Run it with a job you can measure besides orders.
How a High-AOV Kayak Brand Grew Without Betting on Black Friday
The same kayak brand shows high-AOV growth without a one-weekend bet. Its Amazon category had dropped about 50% year over year, so it needed demand it could control.
We built a Google Ads program on Performance Max and Search and launched Google Merchant Center. Over eight months, website revenue rose 98%, orders grew 59%, and paid search clicks climbed from 11,000 to 39,000.
None of that depended on a Black Friday conversion spike. The fishing kayak brand case study shows how steady demand capture carried a considered purchase all year.
Our team maps your real peak lift from your own Shopify data. Free, no obligation, and built on your numbers instead of a vendor's.
How to Calculate Your Expected BFCM Lift From Last Year's Shopify Data
Your own data beats every benchmark in this post, and Shopify already has it. This is how to calculate conversion rate lift in Shopify, and it doubles as a BFCM conversion forecast calculator you can reuse every year.
The five steps below fit on one screen, so save this graphic before you open Shopify Analytics. Each panel matches a step, from the three reports you pull to the adjustments you make last.
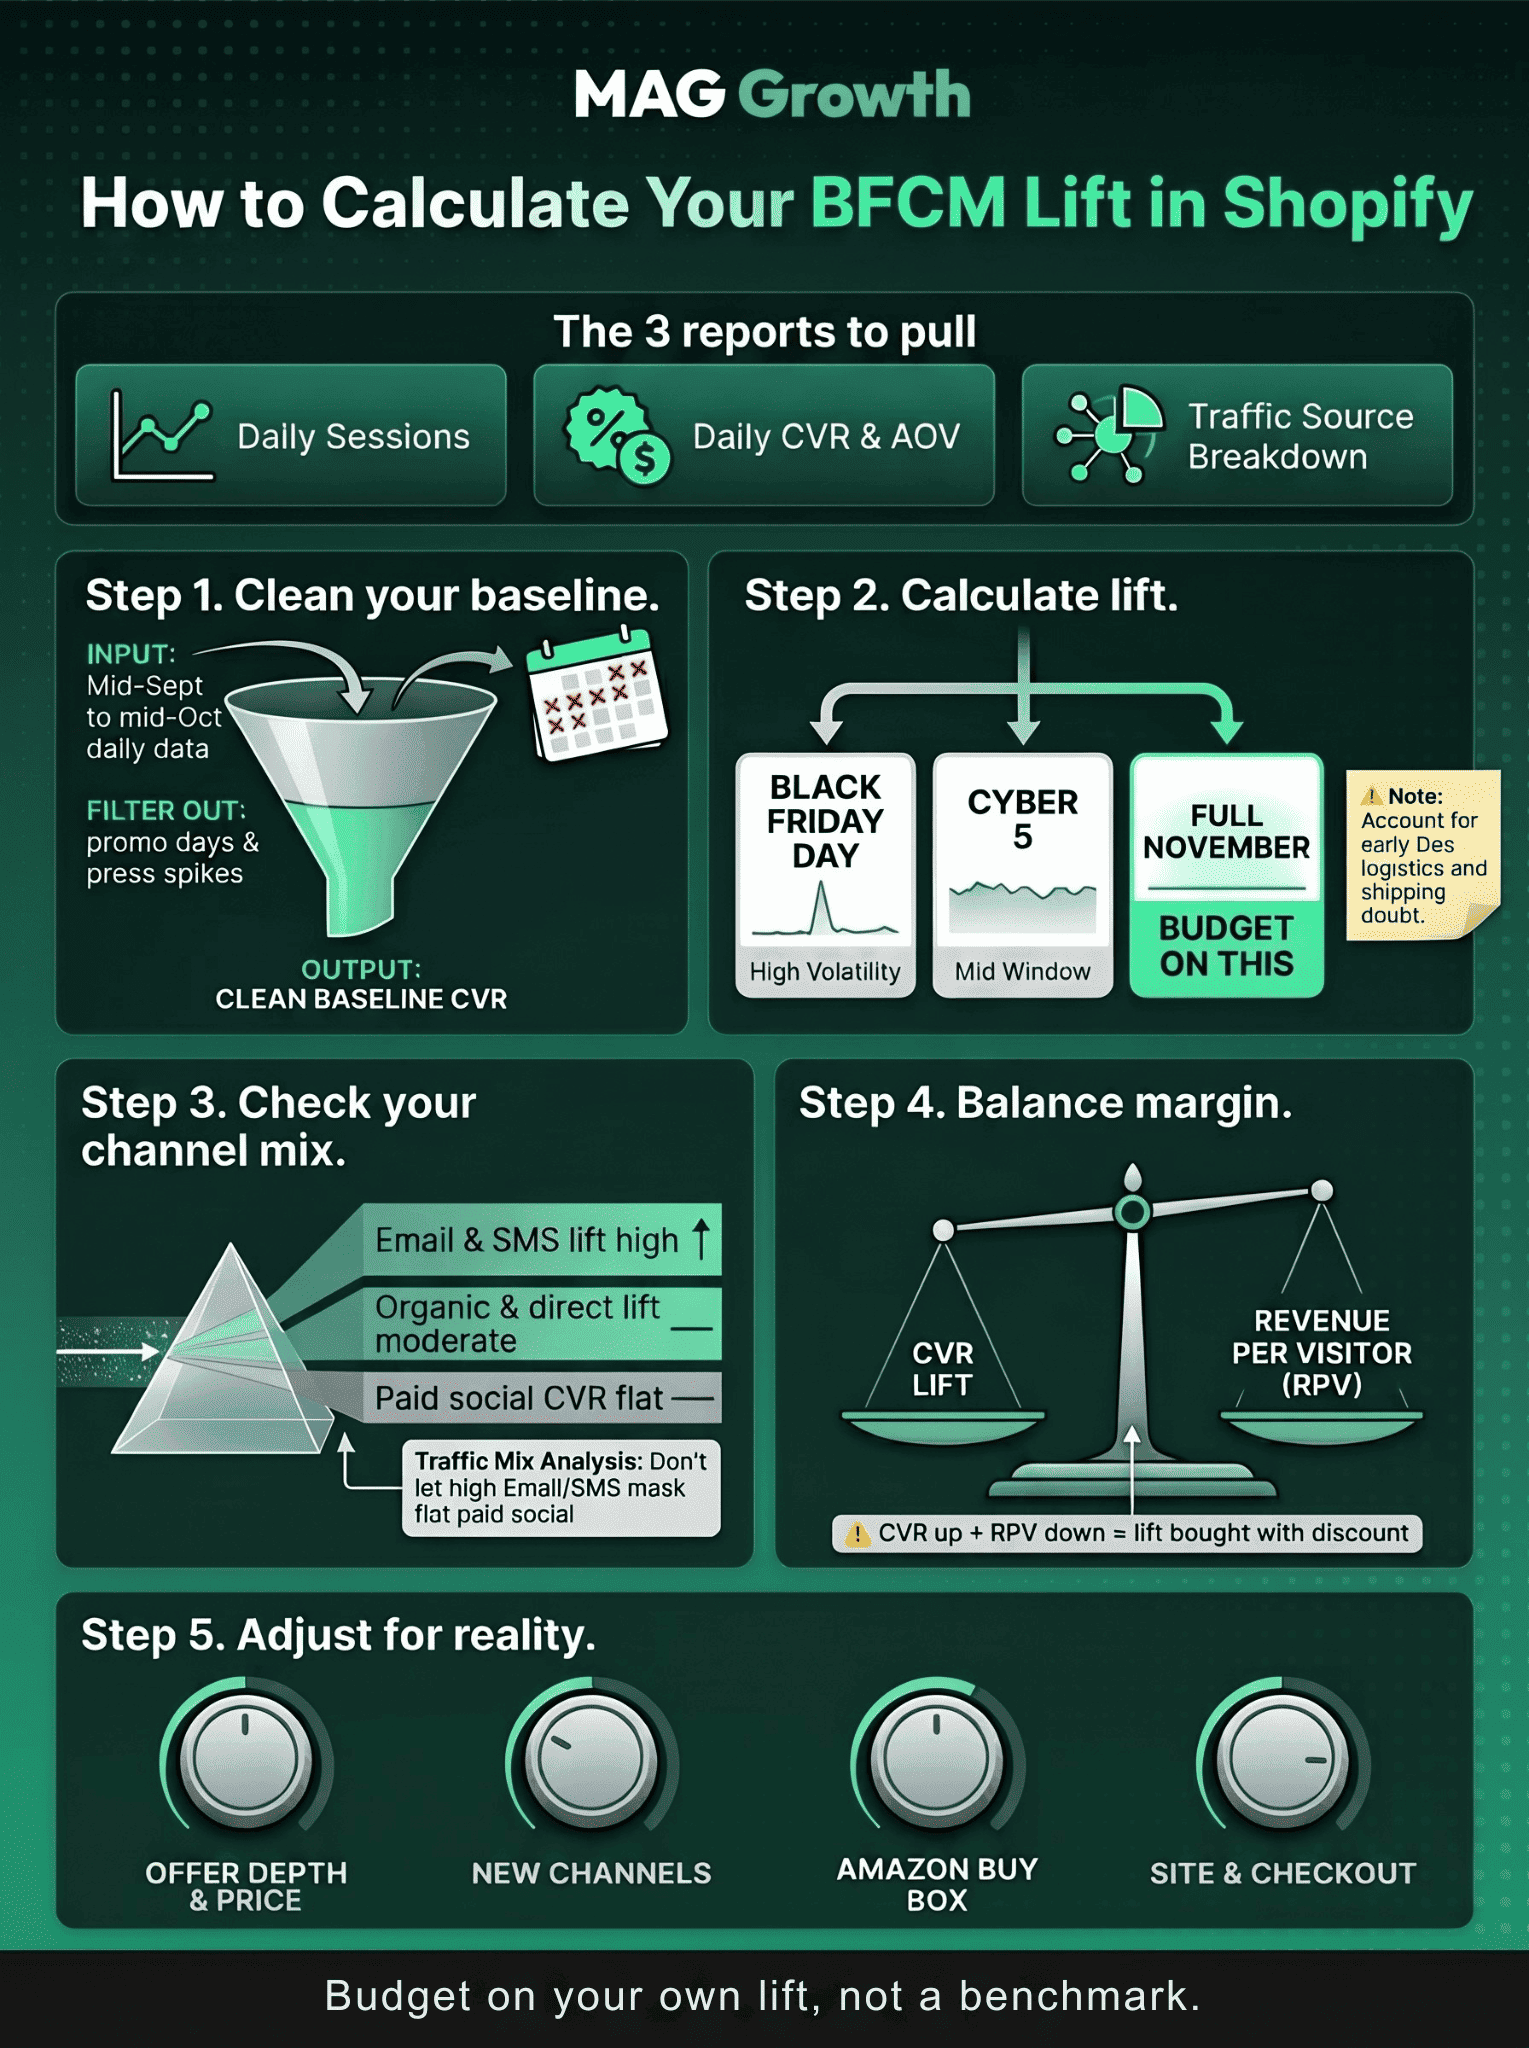
Which Shopify reports do you need to measure peak lift?
Pull daily numbers from Shopify Analytics for last September through December. Add the referrer breakdown, because the traffic mix shifts hard at peak.
- Shopify Analytics sessions by day
- Conversion rate and AOV by day
- Sessions and orders by traffic source
Step 1. Pick a clean baseline window
Use mid-September to mid-October as your baseline conversion rate. Remove any days with promos, launches, or press spikes so the number reflects a normal day.
Step 2. Measure lift in three windows
Divide the conversion rate for Black Friday, the Cyber 5, and all of November by your baseline, then subtract one. Budget on the full-month figure, because Cyber Week conversion rate by day swings too hard to plan around.
Check early December in the same report. If your conversion rate dropped after Black Friday, it is usually the return to baseline plus shipping doubt, and logistics management that keeps delivery promises accurate protects that tail.
Step 3. Split lift by traffic source
Email and SMS traffic lifts the most because those visitors already know you. That can hide a flat paid social conversion rate, which is the channel your new budget buys.
Step 4. Check RPV against CVR
Put Black Friday revenue per visitor next to conversion for every window. If conversion rose but RPV fell, the lift was bought with discount, and our test of sitewide vs tiered discounts for Black Friday shows which offer protects AOV.
Step 5. Apply this year’s adjustments
Adjust last year’s lift for offer depth, new channels, and site changes. If you were raising prices across Amazon and Shopify this year, treat last year’s conversion rate as your ceiling.
Amazon demand moves the forecast too, so run the Amazon Black Friday listing prep checklist on that side. A deep Shopify discount can also cause a Buy Box that disappears after a Shopify sale, which drags both channels at once.
Site work done before November can push your number up. Ecommerce builds that fix mobile checkout, a headless and PWA front end that stays fast under load, and ongoing maintenance that keeps apps stable all protect the lift you calculated.
Landing page testing alone drove a 67% landing page CVR lift for a health and wellness brand. Run the pre-BFCM checkout test before you lock the forecast.
How do you turn your lift into a BFCM ad budget ceiling?
How much a DTC brand should spend on BFCM ads comes down to what each visit can pay back, and that is where BFCM ad budget planning breaks. Start with the max CPA your target MER allows, then multiply it by your realistic peak conversion rate.
- Baseline conversion rate of 1.5%
- Realistic lift of 30%, so 1.95% at peak
- Peak AOV of $120 at a 3.0 MER target
- Break-even CPA of $40, which is $120 divided by 3.0
- Max cost per session of $0.78, which is $40 times 1.95%
Now run the same math on the 3x lift from the vendor report. A 4.5% conversion rate says you can pay $1.80 per session, which is 2.3x what your store can carry.
That gap turns a November budget into a December cash flow problem and a blended CAC you can’t defend. Pairing paid media discipline with landing page testing is how we cut CAC by 42% for a DTC brand.
Mistakes That Inflate Your BFCM Conversion Forecast
Each of these mistakes inflates your Black Friday conversion rate forecast and makes you overspend. Check last year’s numbers against all six before you set a November budget.
Using a vendor’s Black Friday number as a monthly plan
One peak day says little about the other 29. Forecast the month and let the day only shape bids.
Comparing to a promo month as baseline
A baseline that includes a sale distorts every lift you measure. Strip out promo days before you divide.
Ignoring the traffic mix shift
Social referrals drove 16% of U.S. digital traffic over Cyber Week 2025, and that traffic converts colder than email. Our affiliate marketing management team tracks partner traffic separately so a coupon rush doesn’t distort your read.
Reading orders without RPV
Orders can rise while each visitor is worth less. Track revenue per visitor daily through the Cyber 5.
Assuming high-AOV buyers act like impulse buyers
A $400 buyer won’t squeeze a three-week decision into a weekend. Plan their lift near baseline and judge November on captured demand.
Forgetting AI-referred traffic changes the mix
Salesforce found holiday shoppers referred from AI search converted nine times more often than social referrals. Our State of AI Shopper Conversion 2026 report shows how that traffic changes your blended number.
Related MAG Growth Resources
These pages go deeper on each piece. Start with your biggest gap.
Black Friday Conversion Rate vs Normal Day FAQs
What is a normal Black Friday conversion rate for a Shopify store?
A store that converts around 2% on a normal day can expect something near 3.5% on Black Friday itself, less if its AOV is high. Uptain’s 2025 report put the average shop at 3.4 orders per 100 visitors on Black Friday, against 1.92 on a regular day.
A 1% Black Friday conversion rate can still be healthy for a store selling high-AOV products. Our guide to why a Shopify conversion rate runs low shows how to tell a normal number from a leak.
How much higher is conversion on Black Friday than a normal day?
On the day itself, published lifts run from roughly 80% to almost 3x, depending on what you call normal. Global-e measured a 186% lift against an October baseline in 2024 and 146% against early November in 2025.
Why did my Black Friday conversion rate go up but revenue stay flat?
Your discount shrank each order faster than conversion grew, or the extra traffic was colder than usual. Shoplift saw the brands that added the most November traffic get zero lift in revenue per visitor.
Should high-AOV brands expect a big BFCM conversion lift?
Plan near your baseline and judge November on the demand you capture. One high-AOV fishing kayak brand logged a 0.55% conversion rate in its November reporting window, which is in line with its category.
What baseline should I compare my BFCM conversion rate to?
Use a clean mid-September to mid-October window with every promo day removed. Keep that baseline fixed every year so your lift numbers stay comparable.
Does Cyber Monday convert better than Black Friday?
In Adobe’s U.S. data, Cyber Monday wins on total sales, while Global-e’s data shows Black Friday winning on conversion rate. Adobe tracked $14.25 billion in U.S. online spend on Cyber Monday 2025 against $11.8 billion on Black Friday, while Global-e’s 2024 data showed conversion peaking on Black Friday at 186% against 156% for Cyber Monday.
Set Your BFCM Budget on Your Own Lift
- Fix one baseline and keep it
- Plan on monthly lift first
- Judge peak on RPV next to orders
- Set bid caps from your own forecast
Get a pre-BFCM audit that shows your real peak lift and the CAC it can carry. A free ecommerce audit before Black Friday, run by a Shopify CRO team that does this every Q4.