

You are testing creative on Meta to learn what Amazon recorded last quarter. Nobody opened the file.
Amazon Seller Central reports for Shopify strategy means deciding with purchase behavior you already own. Evidence replaces opinion.
MAG Growth runs full-funnel growth marketing for brands representing $1.2B+ in ecommerce revenue across 400+ partners. Almost every Amazon-native account we inherit exports one file and guesses at the rest.
This marketplace strategy guide names the reports you can open, the field to pull, and the decision each one settles. It also covers the cadence that sustains the habit.
Our team reads your Amazon account and names the DTC decisions you currently make blind.

Part One. Your Amazon Account Already Ran the Test
Founders launch Shopify as though the brand opened that morning. Years of buying behavior sit one tab away.
Which Seller Central reports can I actually open?
Access splits in two, and that split decides your plan. You need an active Brand Registry enrollment plus admin permission, which Perpetua details in its Search Query Performance walkthrough.
Brand Registry gates the Brand Analytics dashboards, including Search Query Performance, Market Basket Analysis, Repeat Purchase Behavior, Customer Loyalty Analytics, Demographics, and Search Catalog Performance. Every seller still opens Business Reports, returns files, advertising search terms, and Voice of the Customer.
Why does marketplace behavior predict DTC behavior?
The same shopper buys the same category with money on the table. Meta measures who stopped scrolling, while Amazon measures who typed a query and checked out.
Sample size decides the rest. A $3M Amazon brand records more purchases per quarter than most DTC stores see in two years, which makes using Amazon data instead of paid meta testing faster and cheaper.
What do most brands get wrong about using Amazon data off Amazon?
Four beliefs waste the most money.
- The data works only on Amazon, when query language describes the customer rather than the storefront
- You need software first, when every report downloads as a CSV
- The marketplace buyer differs from your DTC buyer, which our breakdown of where each channel wins disproves
- Exporting breaks the terms, when the amazon customer data you can legally use off amazon covers anything Amazon reports back in aggregate
Which reports matter at each revenue stage?
Revenue decides how much of this earns calendar time. Brands under $3M run search, traffic, and returns data only.
Between $3M and $10M, add basket, repurchase, and customer feedback reports. Past $10M, add Demographics, Loyalty Analytics, and Attribution so the data feeds media buying.
Part Two. What Guessing Costs You
Instinct drains cash faster than any other early mistake. Paying an ad platform to rediscover your own data compounds it.
You are paying to learn what your search data already says
Creative testing buys language your buyers already handed you. Ecommerce Meta CPMs reached roughly $16.80 after climbing 18.3% year over year, according to MHI Growth Engine’s review of 1,247 ad accounts.
Price four angles at 250,000 impressions each. That runs about $16,800 before creative costs, and one export answers the same question free.
Your bundles and subscriptions are guesses
Teams build most Shopify bundles in a meeting. Somebody pairs two products, nobody checks, and it underperforms for a year.
Amazon already recorded which products share a cart and which ones buyers reorder. Skipping that doubles your discovery costs, the pattern inflating DTC CAC benchmarks across the mid-market.
How long does Amazon keep this data before it rolls off?
Windows close sooner than operators expect. Search Query Performance holds roughly seven months per Ad Badger, while detailed advertising reports commonly cap at 60 days as NovaData documents.
Business Reports last around 18 months. Export nothing this quarter and you lose the quarter for good.
Part Three. 12 Amazon Seller Central Reports for Shopify Strategy, Decision by Decision
You already make every decision below. How agencies use seller central data for dtc comes down to twelve files, each carrying one decision.
| Report | Field to pull | Shopify decision it settles |
|---|---|---|
|
Search Query Performance |
Search query, click share, purchase share |
Paid creative angles and ad copy |
|
Sponsored Products Search Term |
Customer search term, orders, spend |
Google Shopping and PMax negatives |
|
Search Catalog Performance |
ASIN impressions through purchases |
Which collection pages to build first |
|
Repeat Purchase Behavior |
Unique customers against total orders |
Subscription eligibility by SKU |
|
Customer Loyalty Analytics |
Loyalty tiers and time to reorder |
LTV assumptions and flow timing |
|
Demographics |
Age, household income, household size |
Lookalike seeding and creative casting |
|
Voice of the Customer |
Negative experience reasons by ASIN |
Product page objection copy |
|
FBA Customer Returns |
Return reason codes and comments |
Size guides, packaging, PDP claims |
|
Detail Page Sales and Traffic |
Unit session percentage by child ASIN |
Conversion baseline and hero SKU |
|
FBA Inventory Age |
Aged units at 271 to 365 days |
What to discount on your own store |
|
Brand Referral Bonus and Attribution |
Attributed sales and bonus earned |
Cross-channel and creator budgets |
1. Search Query Performance sets your paid creative angles
Sort the brand view by purchase share and you rank the promises your product already keeps. Those phrases came from buyers, not a brainstorm.
Read the search query performance report for dtc brands as a message archive. The top queries become your video overlays, Meta hooks, and page headlines.
Brand view returns your top 1,000 queries and ASIN view returns 100 per ASIN, so four quarters of exports gives you a message archive rather than a snapshot.
2. Sponsored Products Search Term report builds your Google Shopping negatives
Your Amazon ads already paid to find the queries that waste money. The same terms drain Google Shopping and Performance Max.
Split the export into converting and non-converting. One list aims at your paid media targeting and the other becomes your negative upload on day one.
3. Market Basket Analysis designs your Shopify bundles
The report names what customers bought alongside your product and how often. Frequency separates an evidence-backed bundle from a hunch.
Market basket analysis for Shopify bundle strategy also prices the offer. Keep any combination running above your category baseline and drop the ones anchored to a single hero SKU, since those are catalog artifacts rather than shopper intent.
4. Search Catalog Performance sets your collection page priorities
This report tracks impressions through cart adds through purchases at catalog level. It marks where shoppers quit.
Strong impressions with weak cart adds signal positioning, not traffic. Fix those pages first in your ecommerce build, because paid traffic cannot rescue a losing page.
5. Repeat Purchase Behavior decides subscription eligibility
The dashboard divides unique customers into total orders and returns a repurchase rate per product. That number decides which SKUs deserve a subscription.
Use the repeat purchase behavior report for subscription decisions as a filter. A product nobody reorders on Amazon will not earn a subscription because your checkout looks better.
Amazon reads the same signal you do, and it now discounts reorders directly through Reorder and Save. Watch how that program works before you price a subscription against it.
6. Customer Loyalty Analytics gives you an LTV starting point
Amazon sorts buyers into tiers and tracks how they move, as ZonGuru explains. That movement proxies lifetime value before your store builds history.
Timing matters more than the tiers. The gap between orders sets your replenishment email, and it checks the loyalty assumptions inflating your bids.
7. Demographics seeds your lookalike audiences
The dashboard reports age, household income, education, gender, and marital status in aggregate. Seeding prospecting with those ranges shortens the learning phase you otherwise fund.
Two limits apply. ZonGuru notes the dashboard runs US only and needs at least 100 customers inside your date range, which suits scale and fails small catalogs.
8. Voice of the Customer writes your product page objection copy
The report lists why customers had a poor experience, tied to specific ASINs. Each reason names an objection your Shopify page ignores.
Most teams open it only when Amazon flags an ASIN. Filter to the poor and very poor experience categories, group the comments into three or four recurring objections, and answer each one beside your add to cart button.
9. FBA Customer Returns fixes your size guides and packaging
Return codes separate fit problems from expectation, damage, and defect problems. Only one describes the product itself.
The stakes run high, since the NRF estimates buyers returned 19.3% of online sales in 2025. At 2,000 monthly DTC orders you process roughly 386 returns.
10. Detail Page Sales and Traffic sets your conversion baseline
Unit session percentage by child ASIN is your Amazon conversion rate. It benchmarks what the product does with warm traffic.
Founders panic at 20% on Amazon against 3% on Shopify. That gap points at the page, which is where ongoing site work pays.
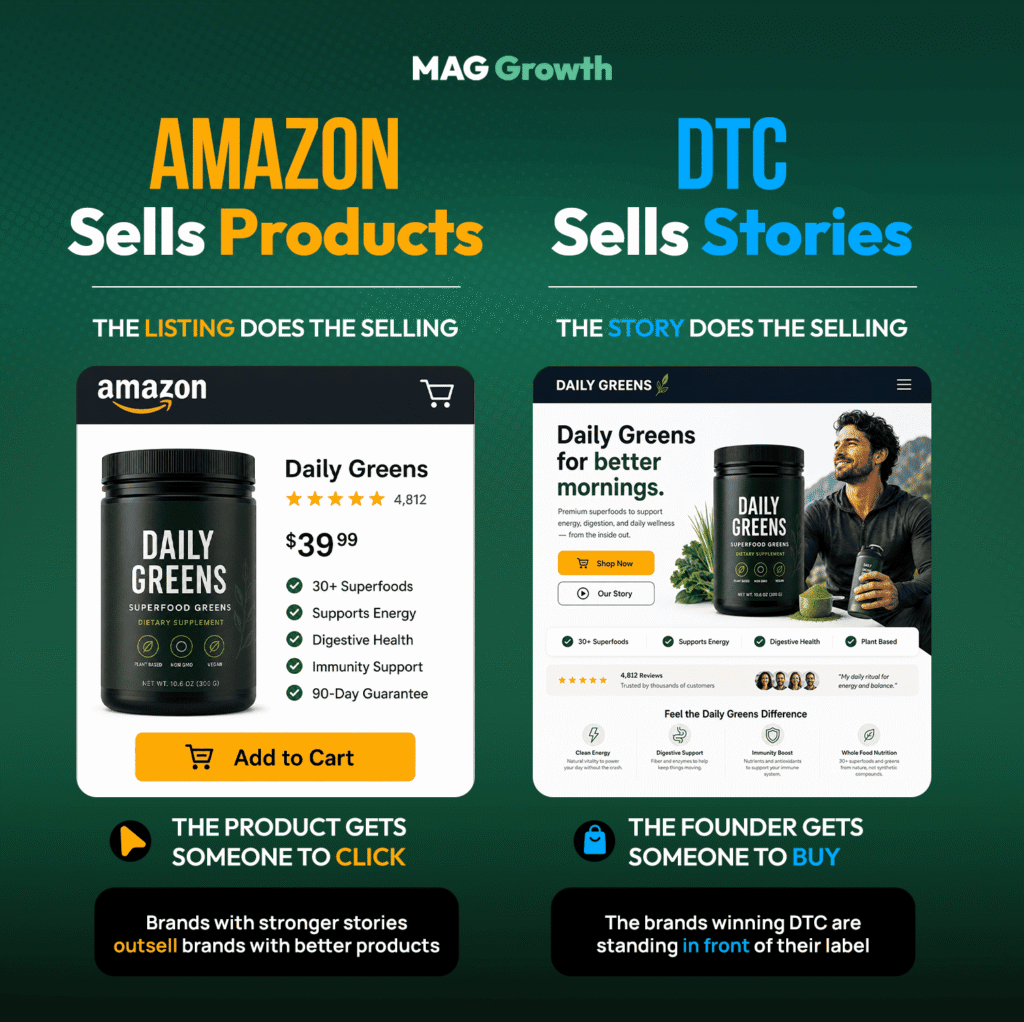
The listing does the selling on Amazon, so the product only has to be found. Your own store has to earn the click with a story before anyone reads a spec.
11. FBA Inventory Age tells you what to discount on your own store
The report flags units sitting 271 to 365 days before long-term storage fees escalate. Discount only those and you protect pricing everywhere else.
Clearing them yourself frees trapped capital and captures the email. Our case study on using DTC email to clear expiring inventory shows the mechanics, where logistics decided the outcome.
12. Brand Referral Bonus and Attribution price your cross-channel spend
Attribution names which external campaigns drove marketplace sales, and the Brand Referral Bonus returns a share of the referral fee that our build and scale playbook puts around 10% of those sales. Together they reveal the true return on any campaign touching both channels.
They also price your creators. A partner driving uncredited Amazon sales looks unprofitable, which is how brands underfund programmatic and upper-funnel media.
What This Looks Like When a Brand Runs It
A pet toy brand came to us with Amazon producing 92% of revenue and holding every customer record. Fees and copycat listings squeezed margin while repeat sales flattened.
We built the owned channel on the marketplace data the brand already held. Buyer questions shaped the pages, purchase patterns shaped the curated sets, and reorder behavior decided which items earned a subscription.
- Revenue grew 78% across nine months
- The owned store reached 52% of online sales by month nine
- Lifetime value landed 4x above the brand’s Amazon customers
Every move traces back to a report above. Read the full pet brand DTC diversification case study for the build behind those numbers.
Part Four. How to Run This Without It Becoming a Second Job
Twelve reports feel like a job because teams treat them as one. Three weekly, four monthly, and the rest quarterly covers it.
Which Seller Central reports should I check weekly?
Choosing which seller central reports to check weekly separates a system from a folder of exports. Owners matter more than frequency.
| Cadence | Reports | Owner |
|---|---|---|
|
Weekly |
Search terms, Detail Page Sales and Traffic, Inventory Age |
Channel manager |
|
Monthly |
Search Query Performance, Market Basket, Voice of Customer, Returns |
Growth lead |
|
Quarterly |
Repeat Purchase, Loyalty Analytics, Demographics, Attribution |
Ecommerce director |
Name an owner for every row before anyone downloads anything. Unowned reports get pulled once and never again.
How do I know the data actually changed anything?
Measure the transfer, not the download. Our full-funnel growth marketing teams hold themselves to five numbers.
- DTC tests avoided per quarter
- Bundle attach rate on basket-validated pairs
- Subscription opt-in rate on repurchase-validated SKUs
- Cold traffic conversion rate on Amazon-sourced copy
- Days from report pull to live change
What goes wrong when brands try this themselves?
Four traps cause most failures, and process causes all four.
- Exporting everything once and never again
- Pulling a report without attaching a decision
- Treating Amazon search volume as DTC demand
- Reusing marketplace images as social creative, since language transfers and format does not
Advanced moves once the basics run
Amazon Marketing Cloud handles cross-channel audience overlap once Attribution runs out of answers. Customer Journey Analytics added ASIN-level detail in late 2025 and maps shoppers from awareness through purchase.
Mature teams schedule these pulls so nobody exports by hand. That query language feeds technical SEO and the GEO work behind our report on AI product discovery across marketplaces.
Reading the files is the part AI handles well once you know which files matter. This walkthrough audits four Amazon ad reports with Gemini and organizes the findings in NotebookLM.
More Marketplace Strategy Resources From MAG Growth
Each resource covers a different piece of running Amazon and DTC as one system. Start wherever your next decision sits.
- The complete guide to scaling DTC from Amazon for the full channel strategy
- Our playbook to transition an Amazon brand to DTC before the store exists
- The seven-step framework to build and scale a DTC brand from Amazon
- Our marketplace channel economics glossary for the terms behind these numbers
- Nine fixes when your Buy Box disappears after a Shopify sale
- How TikTok Shop compares to Amazon for discovery before you add a third channel
Our Amazon marketplace team pulls these reports and turns them into catalog changes, our Walmart team applies the same queries to a second marketplace, and our other marketplace group covers the rest. Buyer language drives our brand identity work too, and brands hunting an amazon brand analytics consultant usually need a multichannel analytics agency for amazon sellers instead.
We rebuilt reporting for brands managing $1.2B+ in combined revenue and will show you what your reports say first.
Amazon Seller Central Reports for Shopify Strategy FAQs
Do I need Brand Registry to see these reports?
You need it for the Brand Analytics dashboards, where most of the value sits. Business Reports, returns files, and advertising exports work without it.
Can I legally use Amazon customer data for my Shopify marketing?
You may analyze and act on aggregate reporting. You may not export buyer contact details or message Amazon customers to move them off the marketplace.
How far back does Search Query Performance data go?
Ad Badger puts it around seven months, depending on your segmentation. Download on a schedule, because early weeks drop off as new ones land.
Does Amazon search volume predict Google search volume?
Not directly, and that assumption costs brands money. Amazon volume measures purchase intent inside a marketplace, so borrow the phrasing and size demand elsewhere.
Which report should I pull first if I only have an hour?
Pull Search Query Performance filtered to purchase share, the first of the best amazon reports for dtc growth decisions. It delivers messaging and ad angles together.
Can I export these reports automatically?
Yes, through the Selling Partner API, which requires the Brand Analytics role for gated dashboards per Amazon’s developer documentation. Most brands under $10M skip amazon data tools for multichannel brands and export manually.
Does Market Basket Analysis work for a small catalog?
It needs enough multi-item orders to surface real combinations. Below a few hundred monthly orders, use returns and repeat purchase data instead.
Are Amazon reviews and returns data reliable enough to change my product page?
Return codes give you the most reliable qualitative data you own, because customers paid before they complained. That beats any survey response.
Is Triple Whale worth it for Amazon and Shopify?
Yes, because it answers a different question. Anyone weighing amazon brand analytics vs. Shopify analytics compares a strategy input against an execution measure, which is why Triple Whale’s benchmarks put median Meta CPA near $38.99.
Key Takeaways and Your Next Step
- Brand Registry unlocks most useful data
- Each report settles one decision
- Search data replaces expensive creative testing
- Return codes deliver free conversion research
- Cadence and ownership beat one-time exports
Owners running Amazon themselves should pull reports 1, 3, and 8 this week. Those settle your ad angles, bundles, and page copy.
Growth leads at $5M to $20M brands should install the cadence table and assign owners. The reports never break, but unassigned work always does.
You do not need to hire a team to build dtc reporting from amazon data to start. Our amazon to Shopify data audit costs nothing, carries no obligation, and you keep the findings.
Send us account access and our team pulls the twelve reports, then hands back the decisions behind them.